
This Is Where Bitcoin Bottoms.
$5.7B liquidated and a 22% dump for BTC since Monday. Here’s what the data says happens next.

Gm legends, and welcome back to another edition of CR’s Vault! 🔐
$5.7B liquidated since Monday. BTC started the week at $77,800 and has collapsed to $60,400 - a brutal 22% dump in days. MOT government selling combined with a broader risk-off wave has been the narrative. But here’s the thing - the liquidity map had these levels marked well before the selling started. The news is the excuse they’ll use to tell you what caused this move - but liquidity was the real reason.
The move that defines this week happened fast and hard. And right now everyone is asking the same question - is this it, or is there more pain to come?
Before I get into the levels, I want to show you the one chart that puts this whole move in context. It’s the most important thing to understand before reading anything else this week.
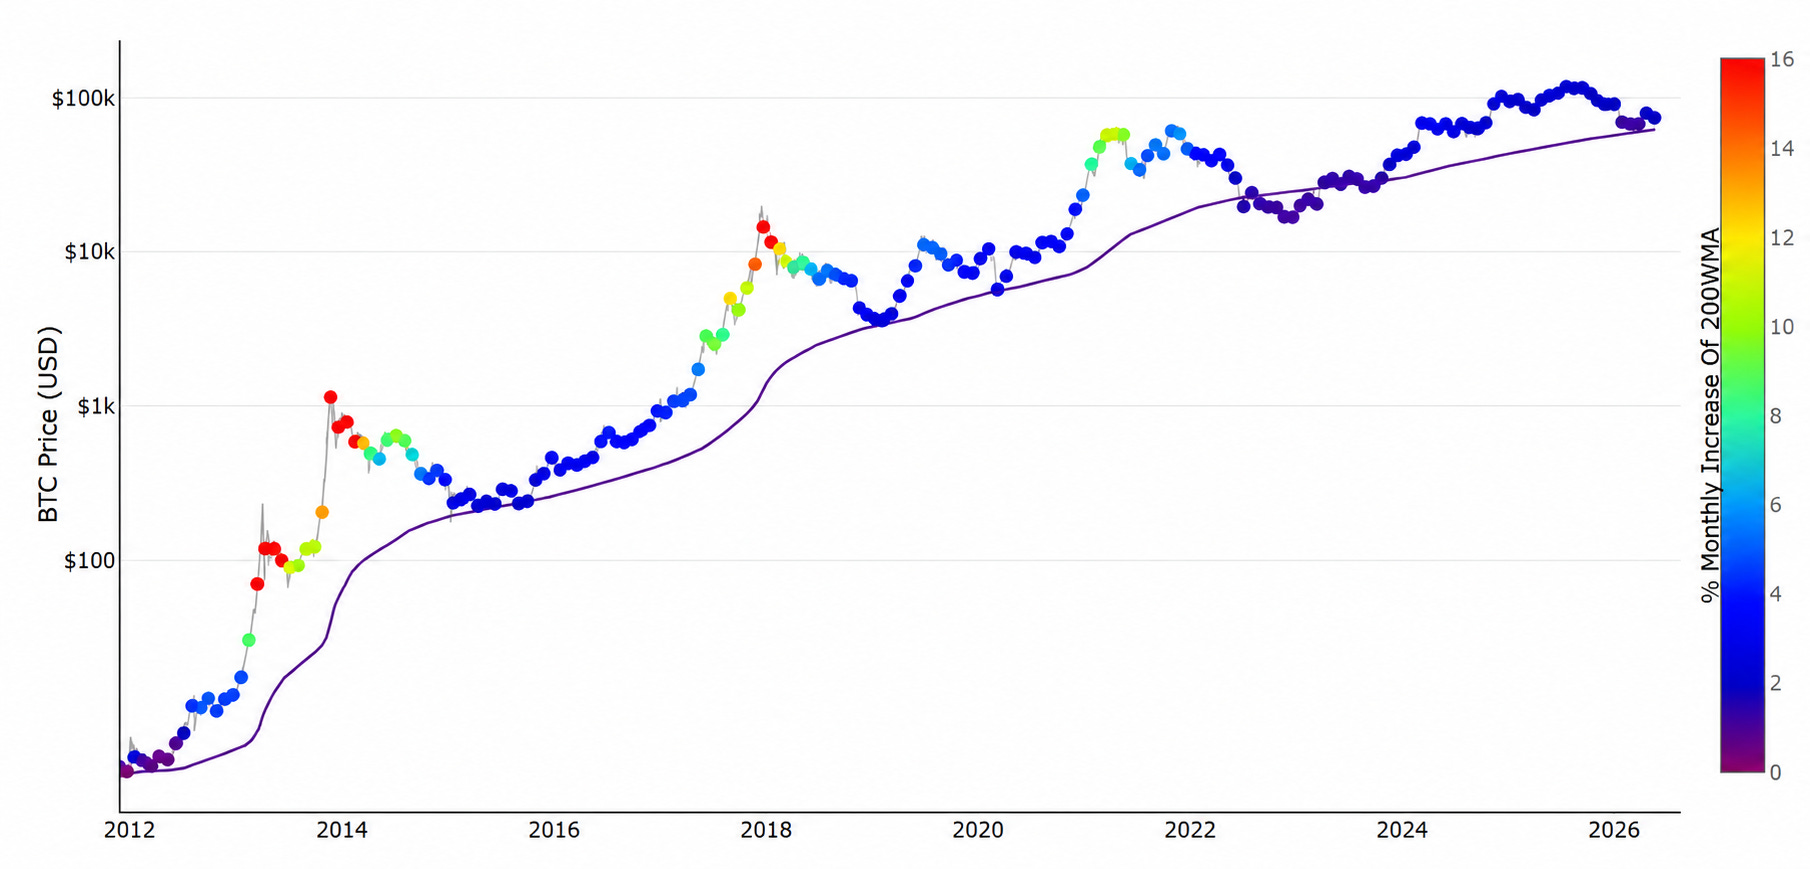
The 200-week moving average - the single most reliable long-term floor in Bitcoin's history, the level that marked the exact bottom of every previous cycle - is sitting right at $61,000. BTC is at $60,400. We just tagged it for the first time this cycle. Every previous time this has happened since 2015, it marked the bottom. That doesn't mean it automatically holds this time. But it's the most important chart in the market right now and you need to know about it before reading anything else this week.
What the heatmap is showing from $60,400 is one of the more interesting setups I’ve seen in weeks. The $1.16B sitting above hasn’t been touched. The on-chain signals are starting to diverge in a way that matters. And there’s one altcoin this week - ZEC - with a story behind the price action that makes the setup genuinely unusual.
Let me show you exactly what the data is pointing to from here.
Keep reading with a 7-day free trial
Subscribe to CR's Vault to keep reading this post and get 7 days of free access to the full post archives.