
Blood In The Streets.
The liquidation machine just ran $1.74B through the market. Here’s what comes next.

Gm legends, and welcome back to another edition of CR’s Vault! 🔐
$1.74B liquidated since Monday. BTC started the week at $77,800, grinded lower all week, then yesterday happened. A single-day dump to $72,500 - the lowest BTC price in over a month - that wiped out $650M in long positions in one session. In one day.
That number is worth sitting with. $650M in longs liquidated in 24 hours isn’t a correction. It’s a flush. The kind of move the market makes when it’s done extracting value from one side before it commits to the next direction.
Most people will tell you the dump was triggered by news of renewed US military strikes on Iran and Trump stating he was “not satisfied” with peace negotiations - the ceasefire hopes that had been holding risk assets up evaporated overnight. And sure, that’s what the headlines say. But here’s the thing. The liquidity map had $72,500 marked as a major target all week. The heatmap was already pointing there before a single headline dropped. The news didn’t cause the move - it was the excuse the market used to get to a level it was always going to visit.
Here’s what I find most interesting about yesterday’s dump. It was fast, aggressive and clean. Price hit $72,500 and bounced immediately. No slow grind lower. Simply a quick sweep and a recovery - which is exactly the pattern the heatmap had been pointing towards all week.
BTC is now at $73,700. The question everyone is asking is whether $72,500 was the low or whether there’s more pain ahead. The liquidity data is already showing where the market is likely to go next - and I want to show you exactly what it’s telling me before I get into the full breakdown.
There’s one chart I want to show you first. It puts everything in context.
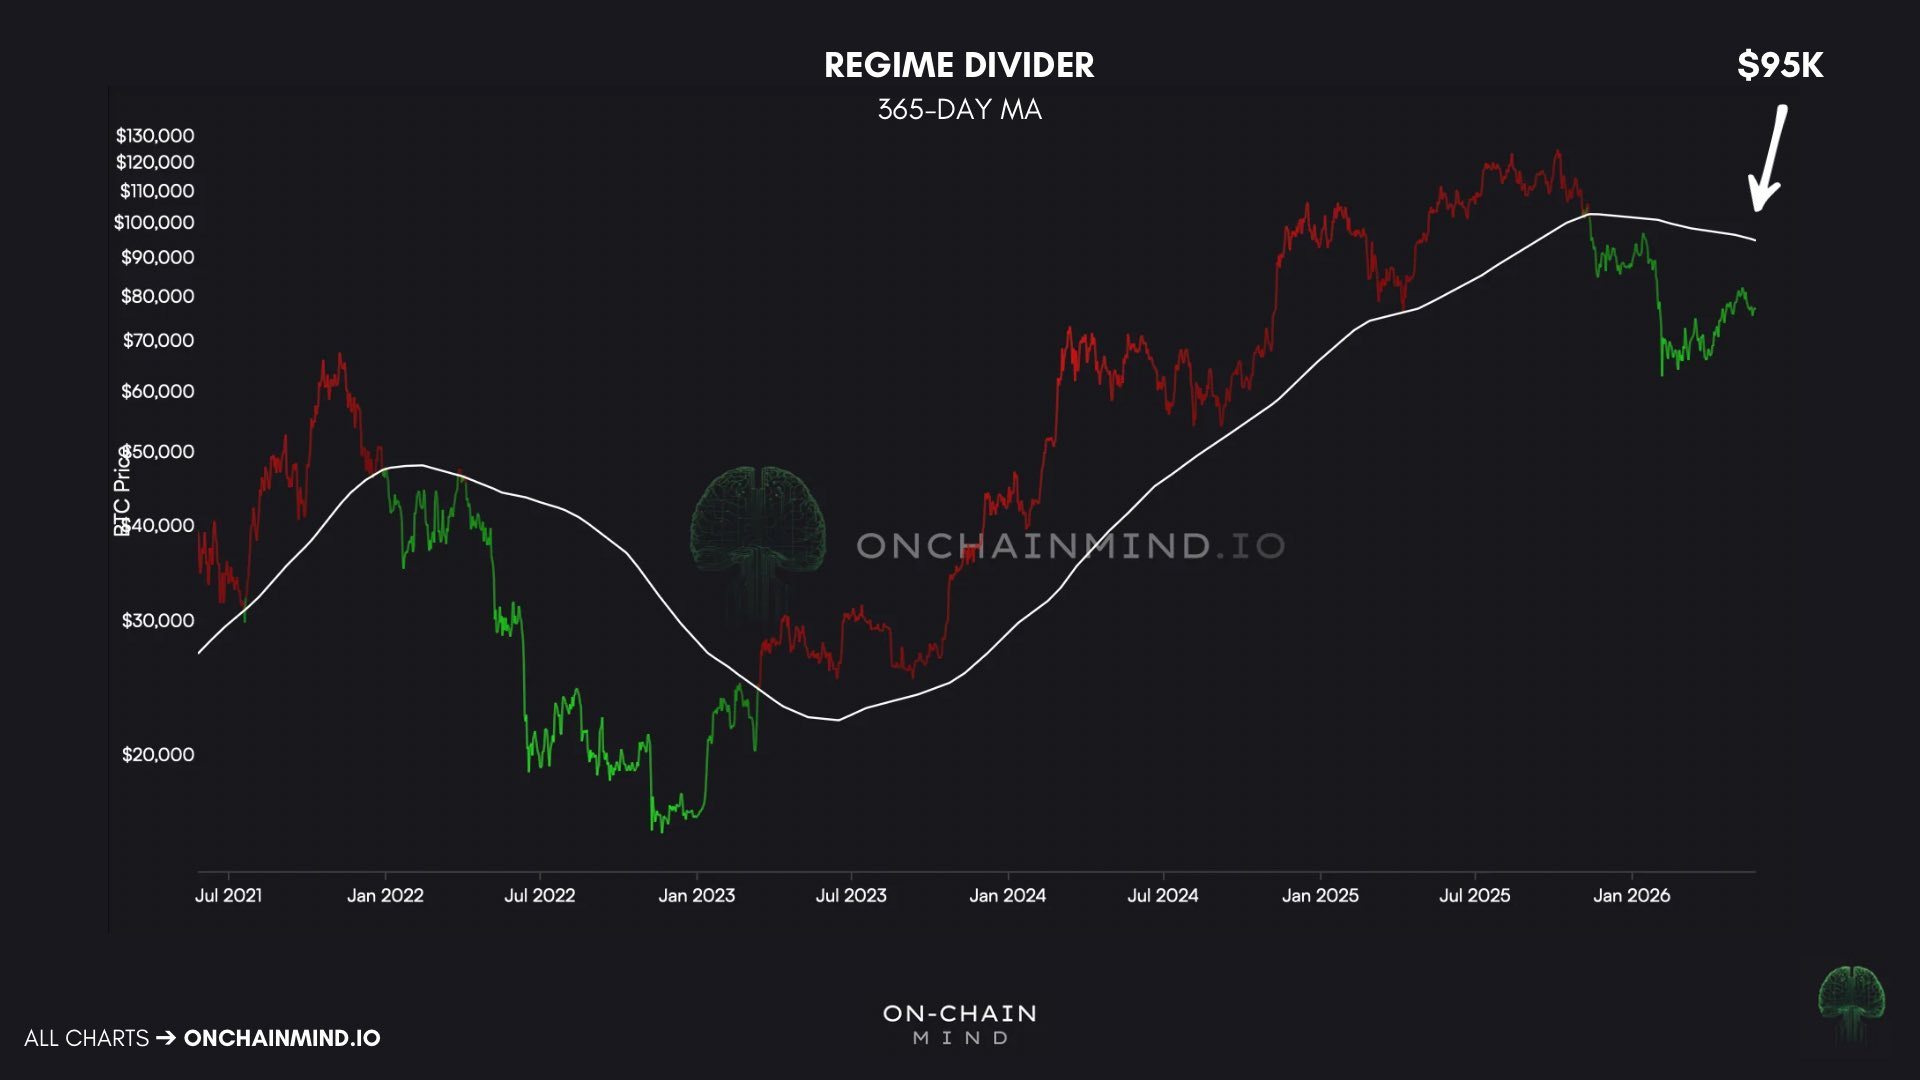
The 365-day moving average is sitting around $95,000. That’s the line that separates a bull market from a bear market for the average buyer of the past year. Every buyer who bought BTC in the last 12 months is currently underwater. That pressure doesn’t release until price reclaims $95,000 - and until that happens, the broader bearish bias remains structurally intact.
That’s the macro context. Now here’s what the heatmap is showing for this weekend - and it’s one of the cleaner setups we’ve had in weeks.
The full breakdown - every level, every zone, my complete lean and three altcoin setups - is below.
Keep reading with a 7-day free trial
Subscribe to CR's Vault to keep reading this post and get 7 days of free access to the full post archives.